The most fundamental choice in any data visualization project is how your real-world values will be translated into marks on the page or screen. In this exercise we’ll be encoding an extremely simple data set repeatedly in order to exhaustively catalog the different ways a handful of numbers can be represented.
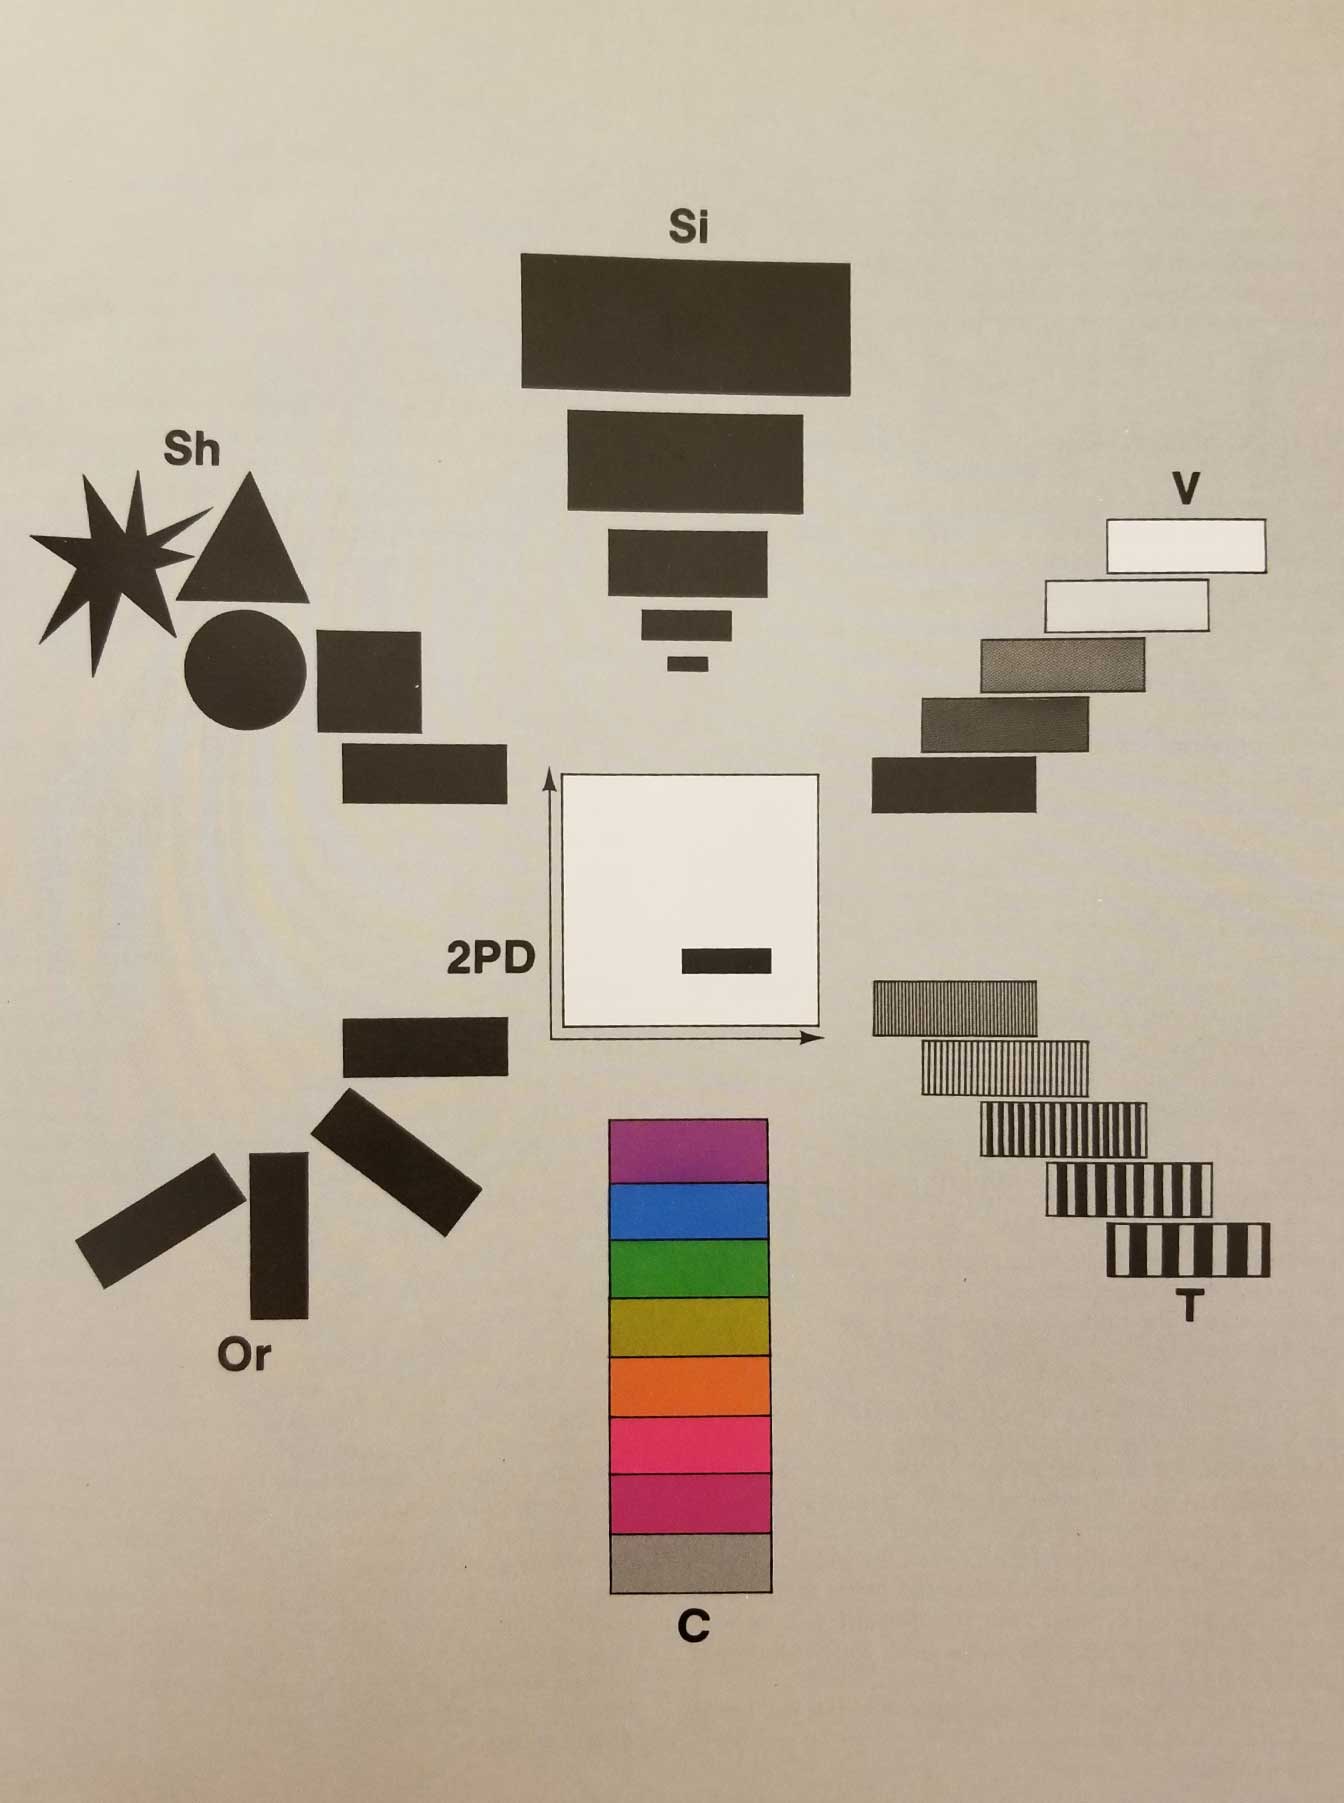
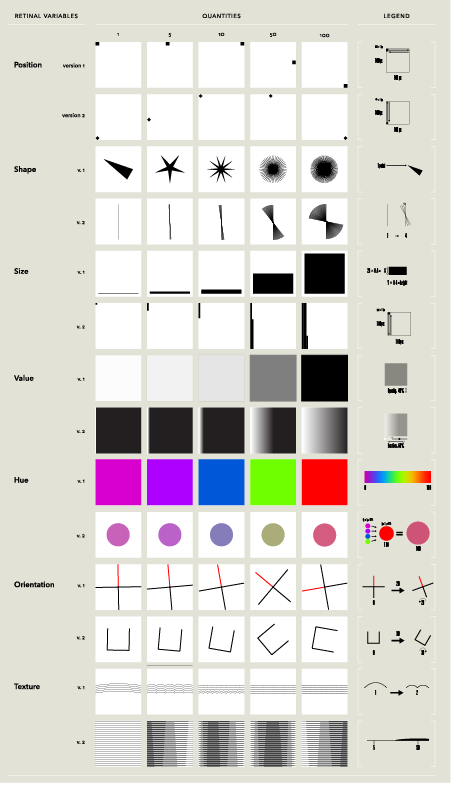
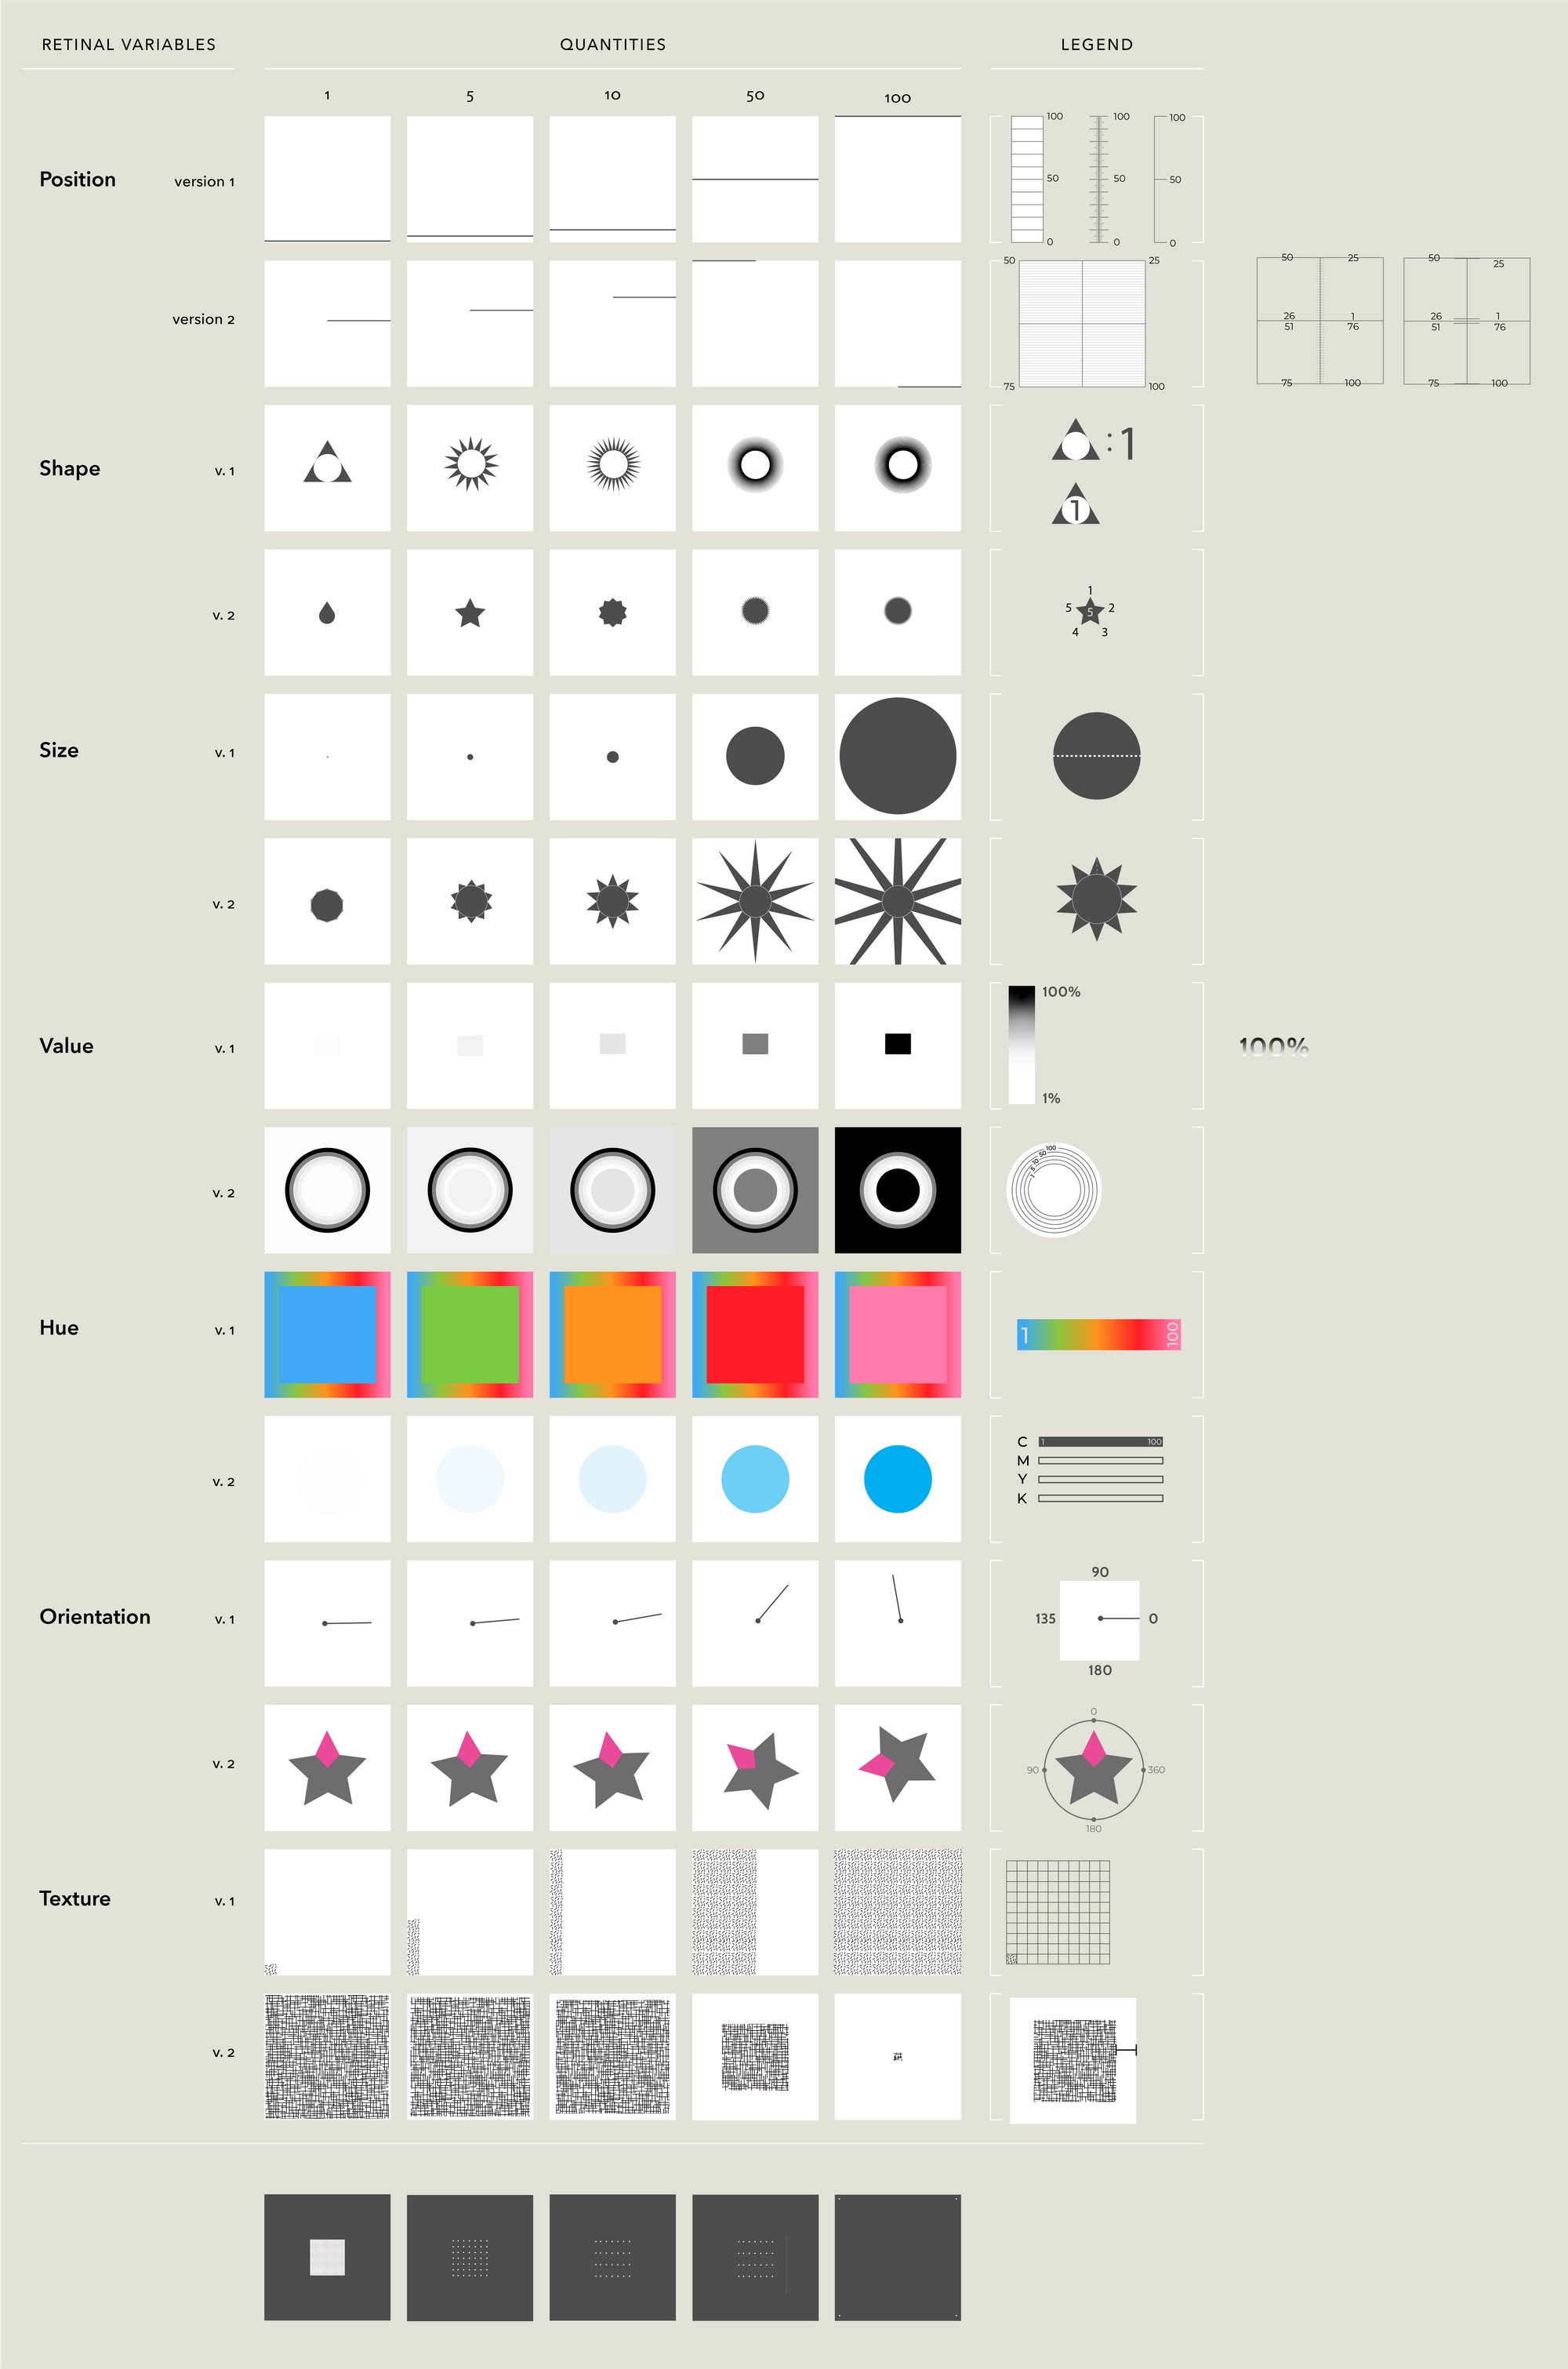
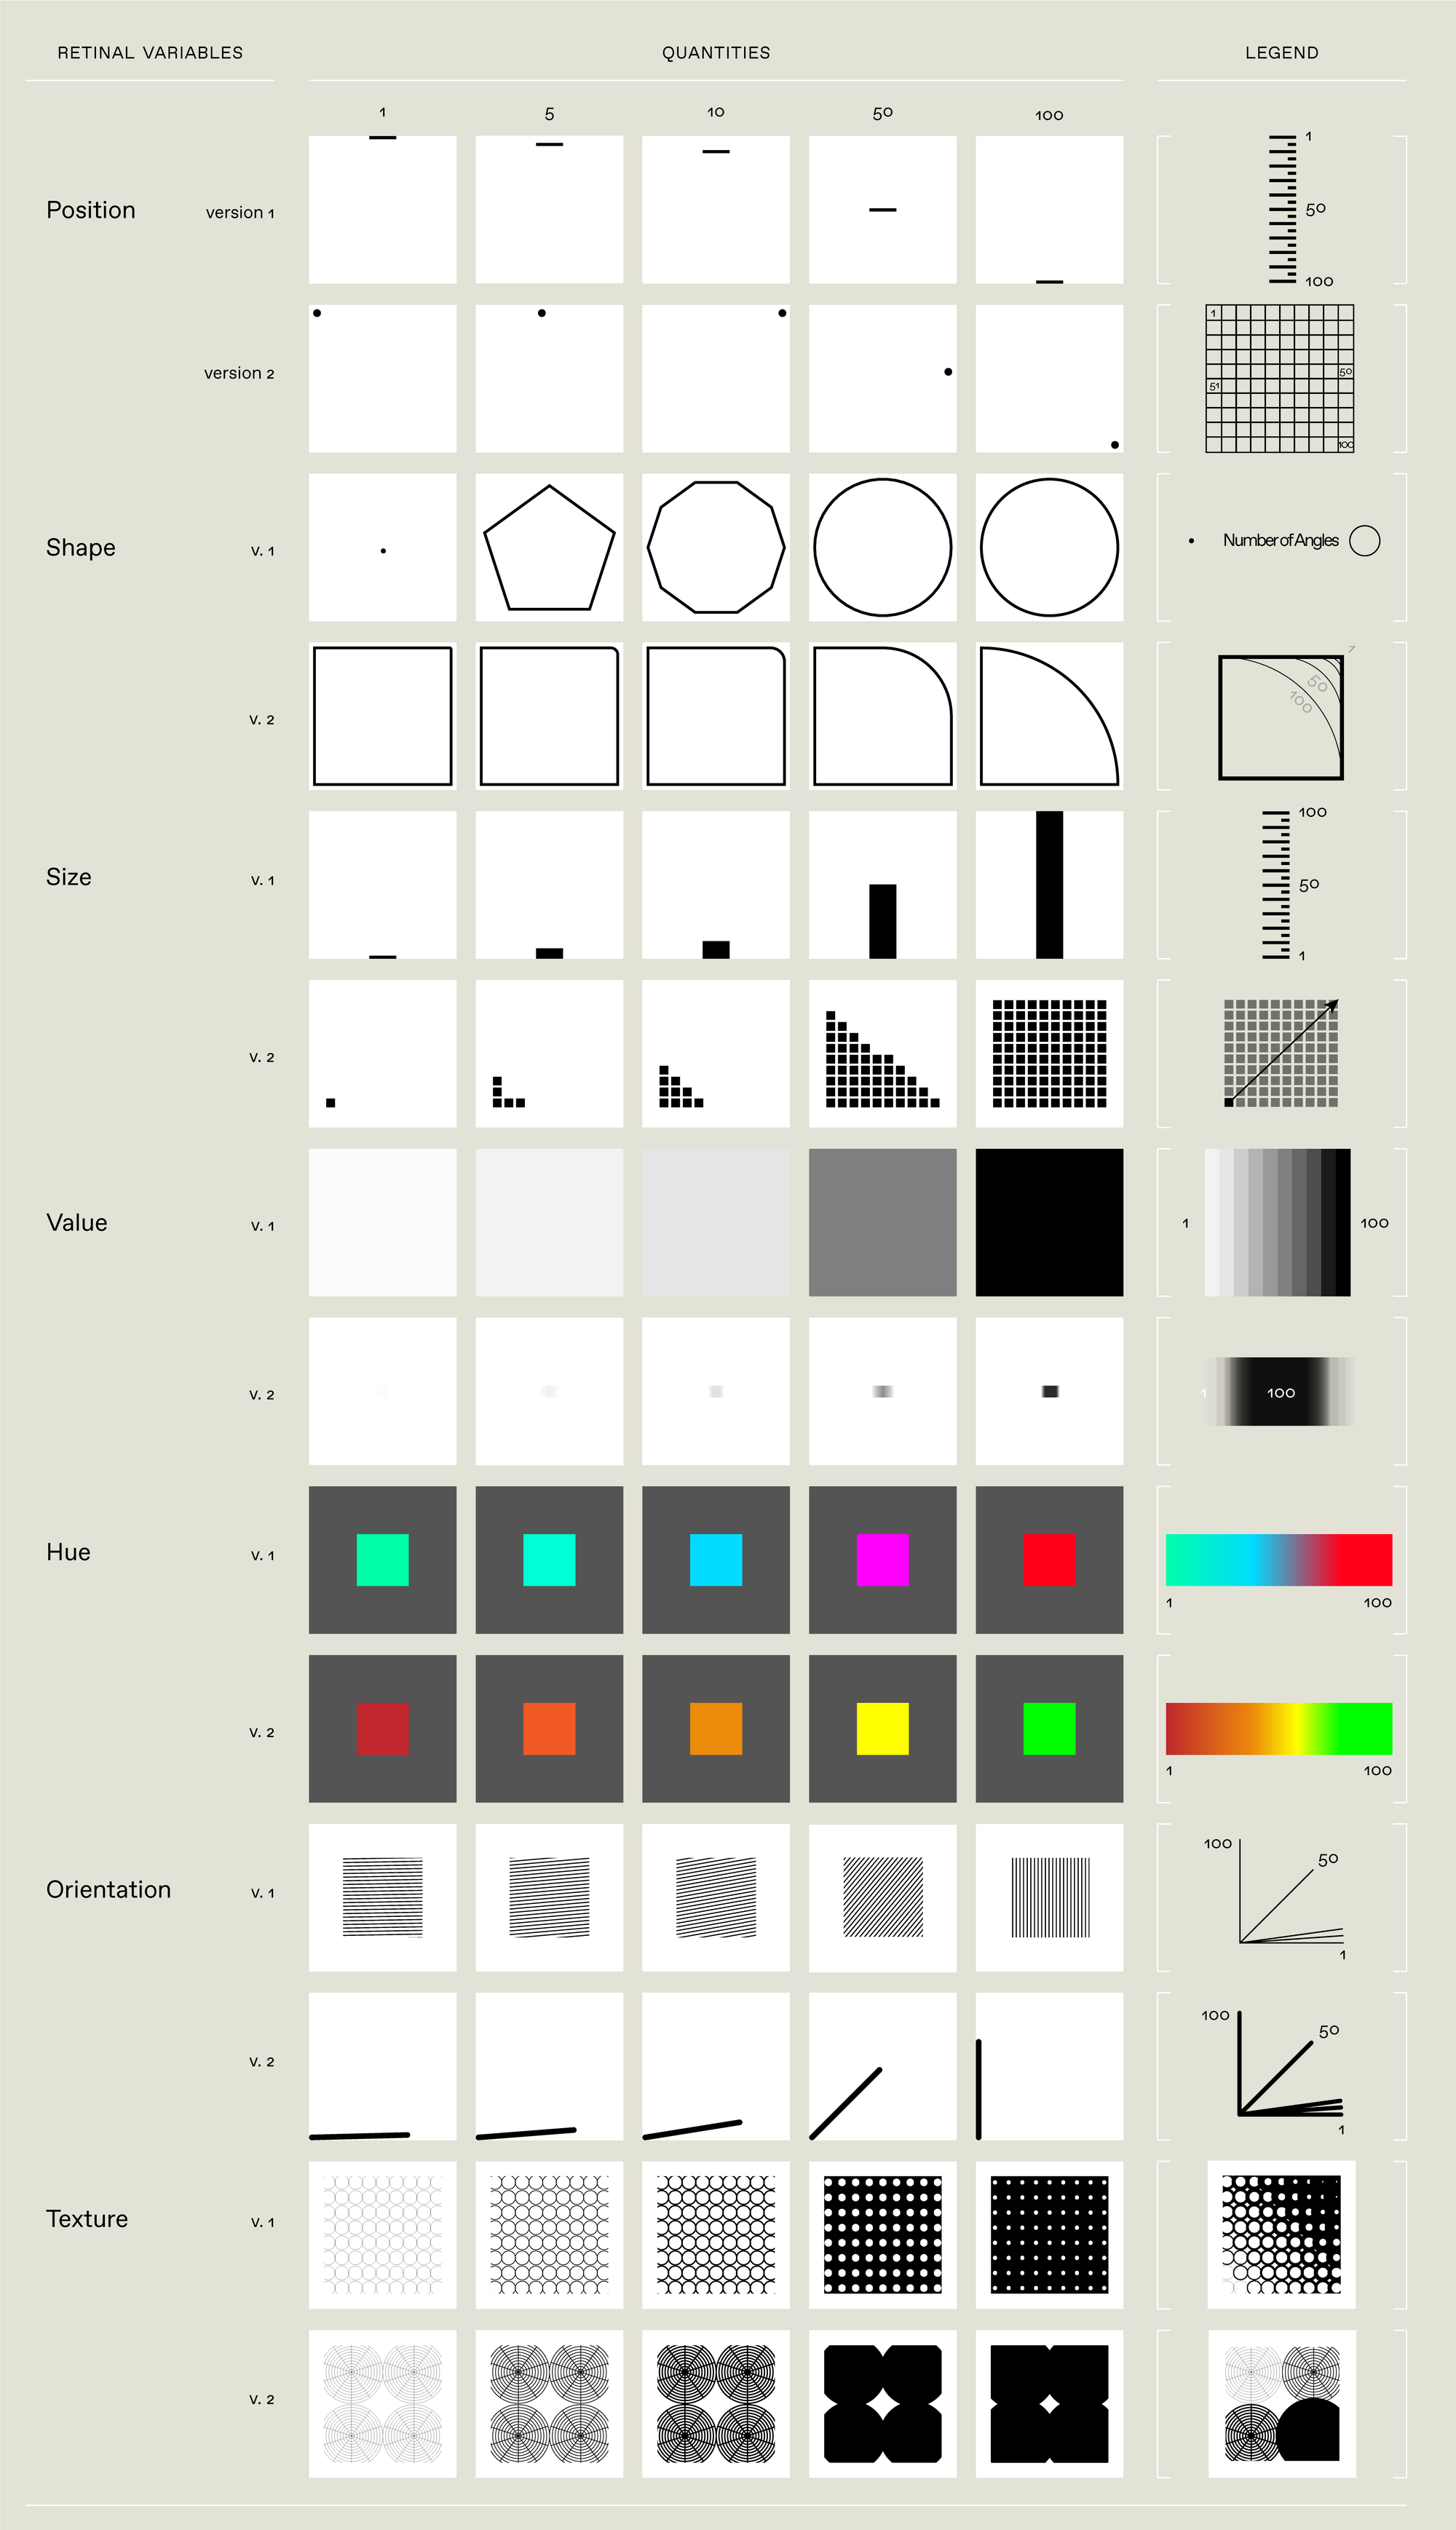
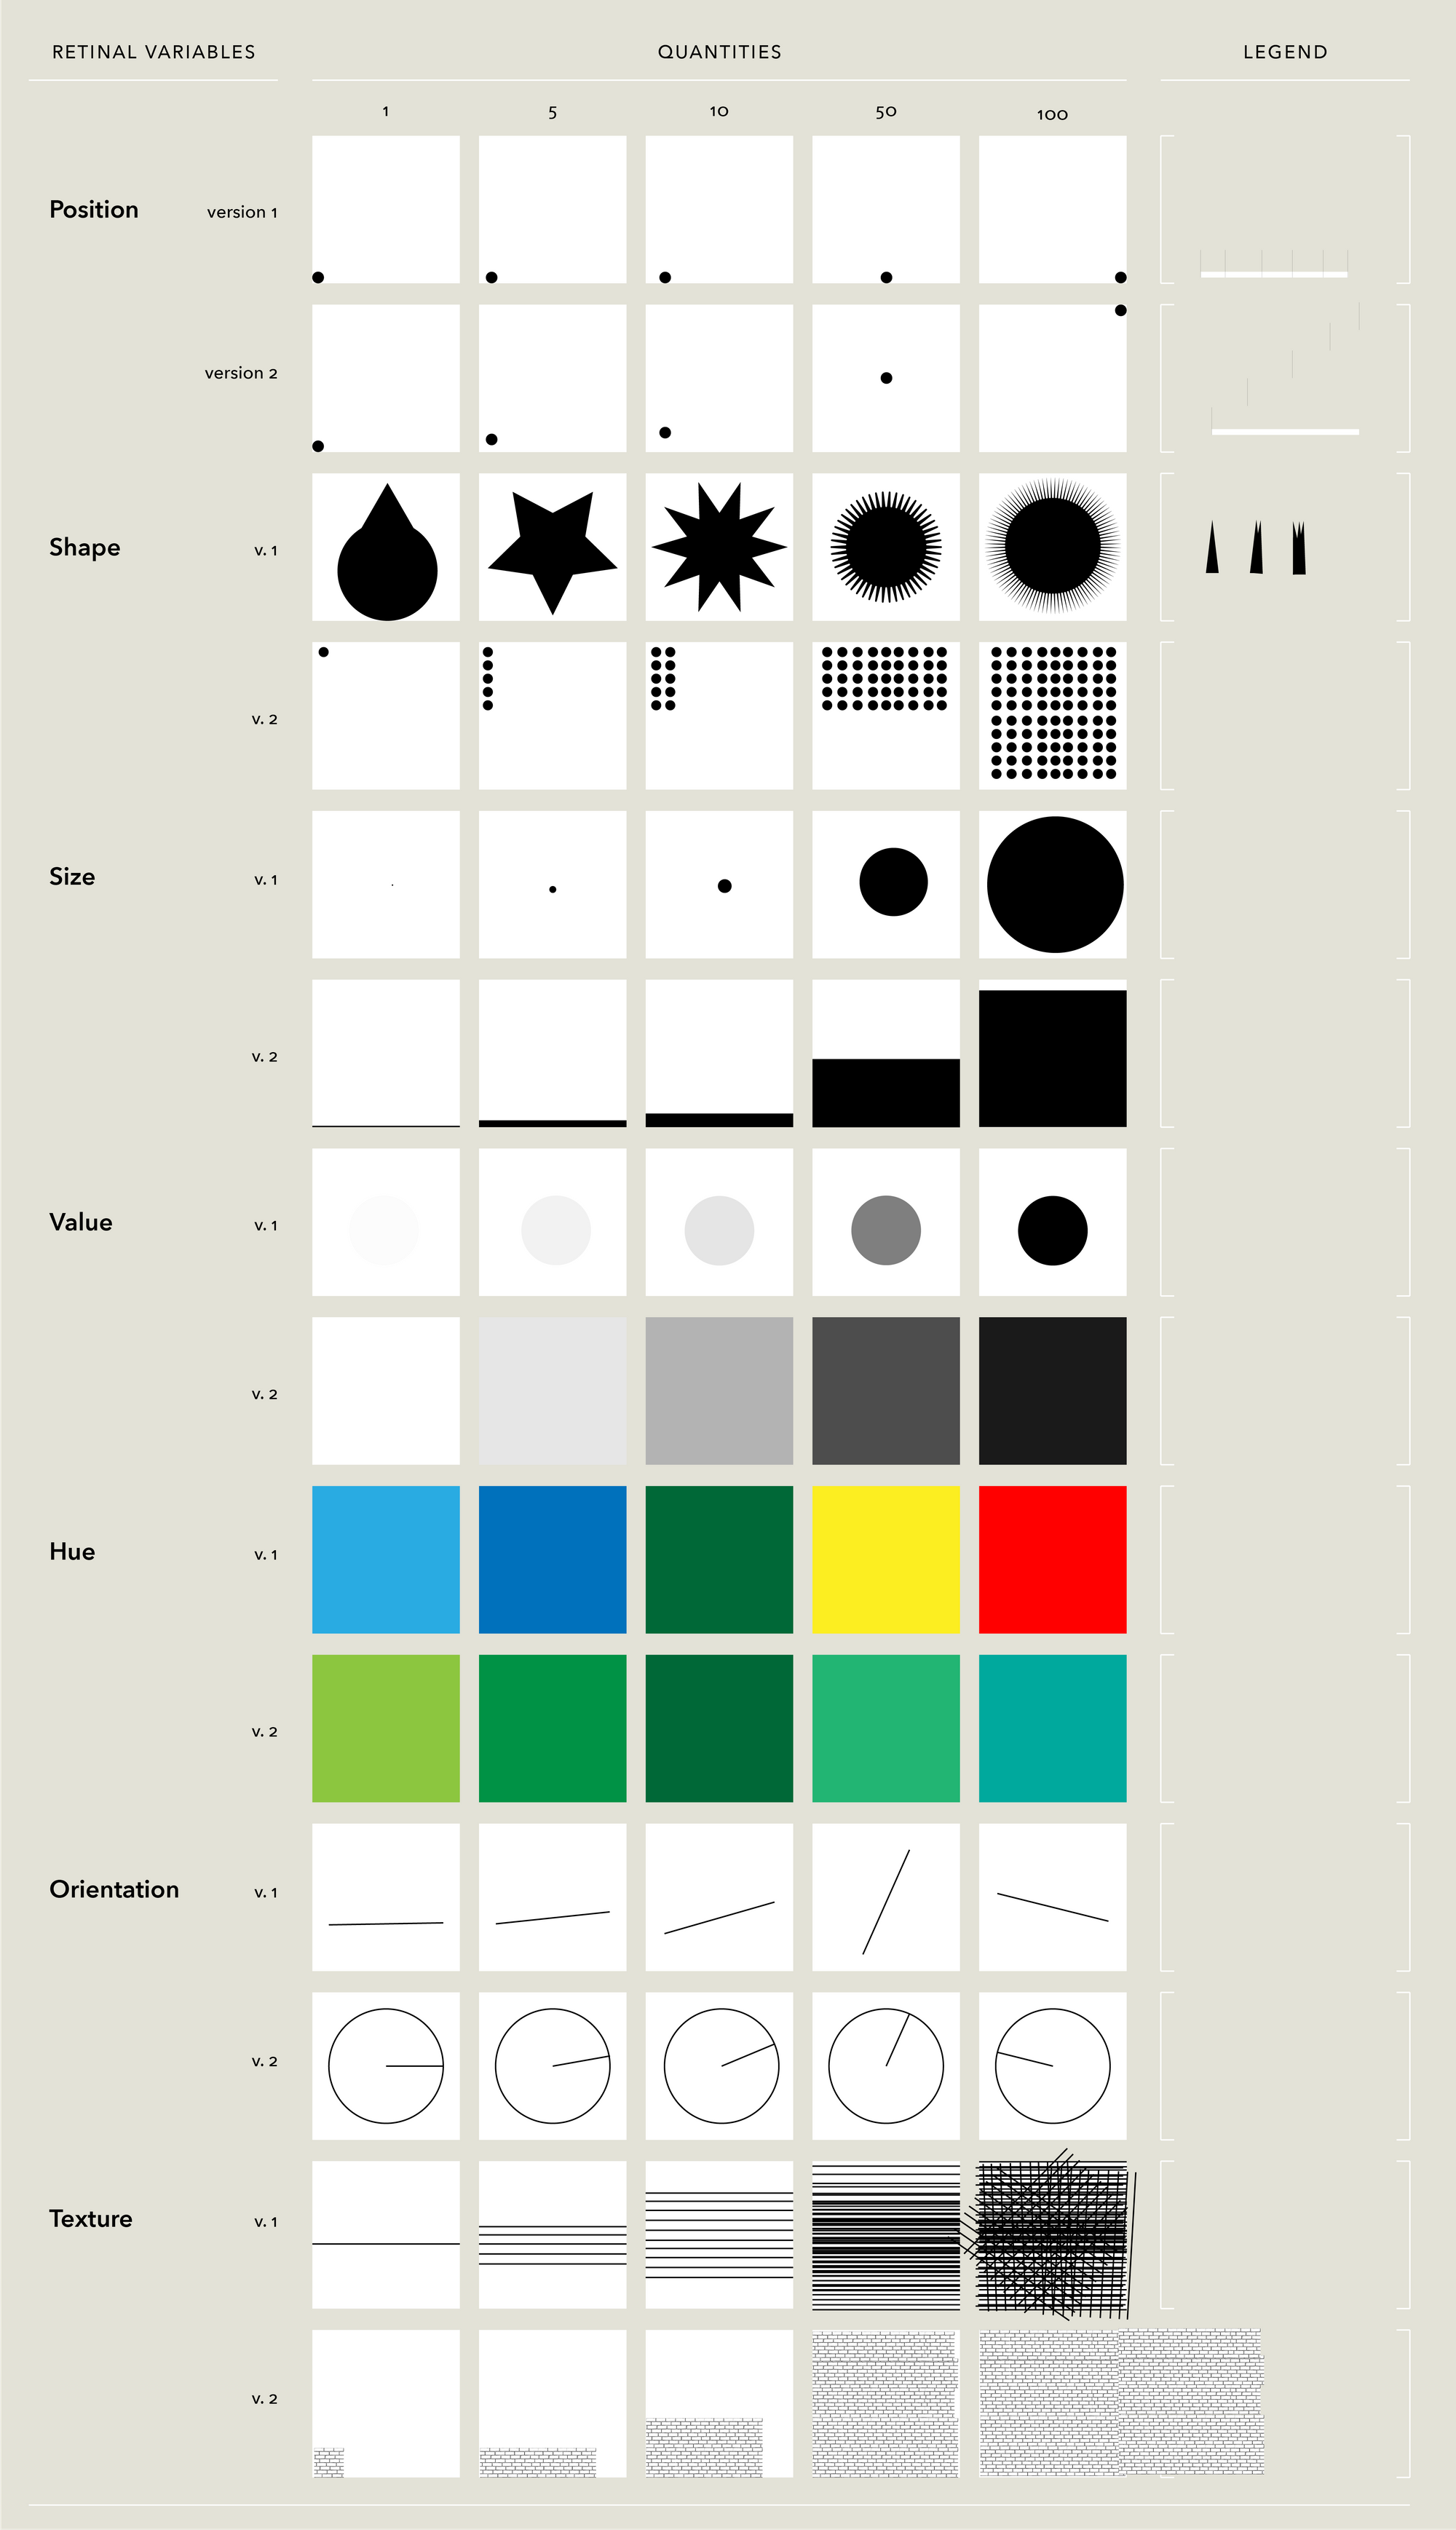
Refer to Jacques Bertin’s cheat sheet from The Semiology of Graphics for all the ways quantitative and qualitative can be encoded visually: